Webmaps
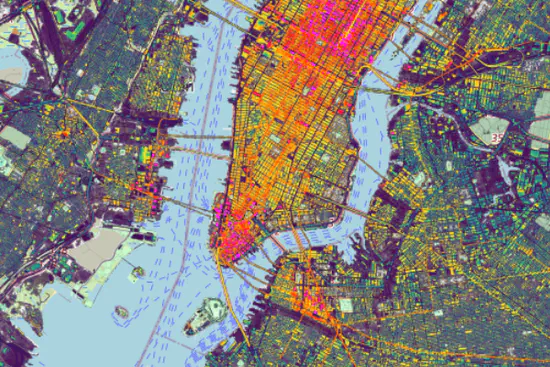
Material Stocks (CONUS)
Unveiling patterns in human dominated landscapes through mapping the mass of US built structures.
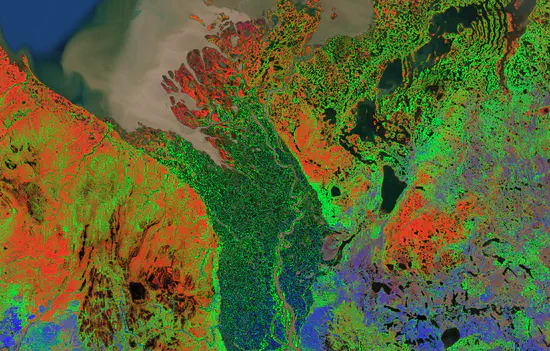
Arctic shrub
Arctic shrub expansion revealed by Landsat-derived multitemporal vegetation cover fractions in the Western Canadian Arctic
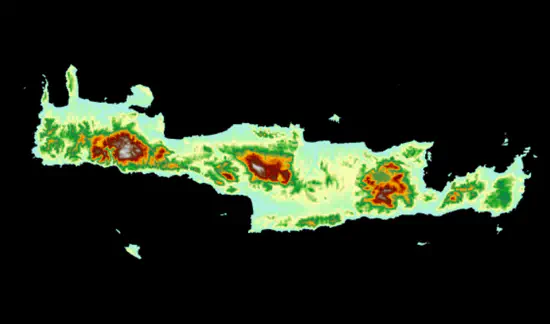
Crete
Revisiting the Past: Replicability of a Historic Long-Term Vegetation Dynamics Assessment in the Era of Big Data Analytics
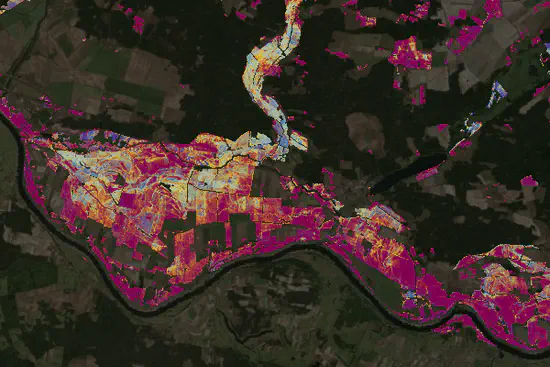
Drought impacts on grasslands
Annual maps of strength and duration of drought impacts on grasslands in northeastern Germany. Based on Sentinel-2 time series from 2017 to 2020).
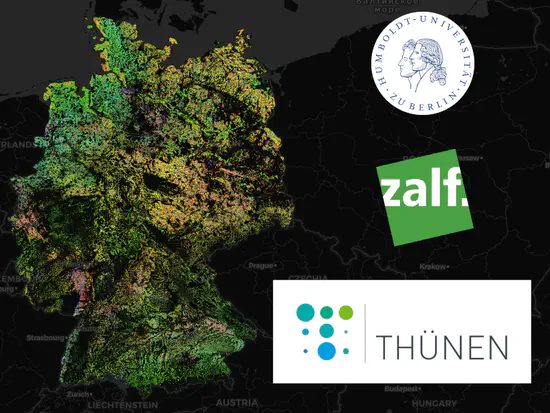
Crop type maps for Germany
Annual crop type maps for Germany between 2017-2019.
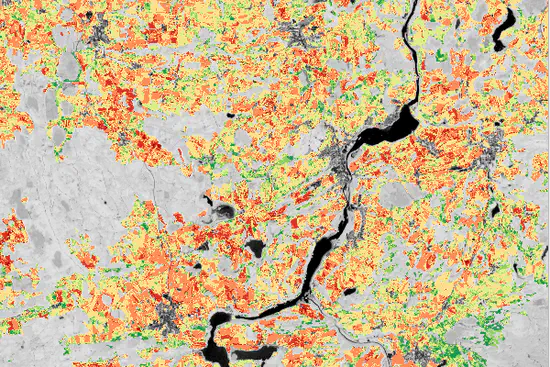
Mowing Events
Mowing events derived from integrated Landsat 8 and Sentinel-2 time series at a spatial resolution of 10 m for the years 2017 - 2020.
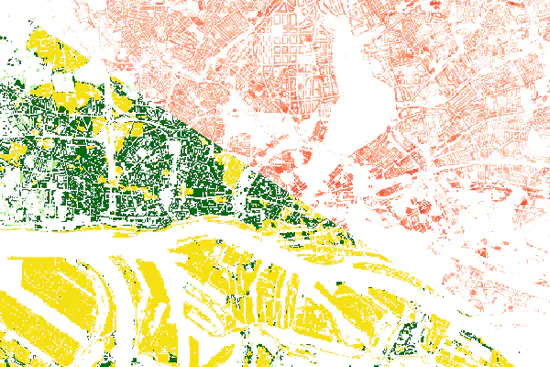
Population
Gridded population map, Germany, based on building density, height and type (year: 2018).
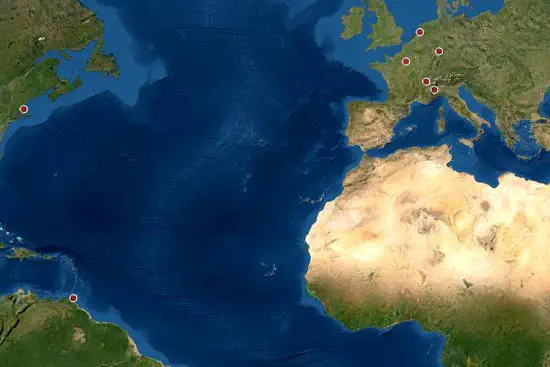
Settlement Mapping (Q-Team)
Visualization of student projects in the course Remote Sensing for Settlement Mapping, Summer 2020
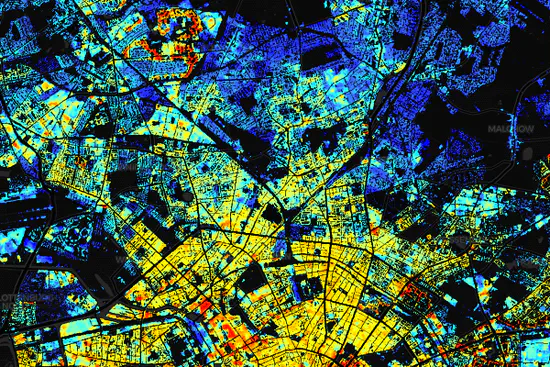
Building Height
Map of building heights at a spatial resolution of 10m for the entire Germany (year: 2018).
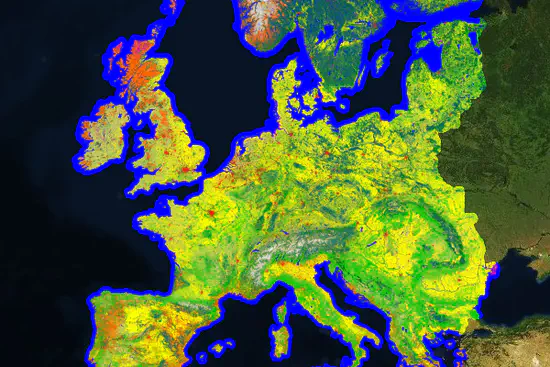
European Land Cover
Map of twelve land cover classes across the entire Europe at 30m spatial resolution (year: 2015).
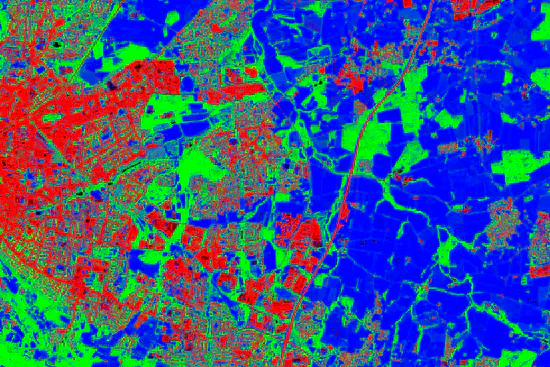
Land Cover Fractions
Fraction map of three land cover types (imperviousness, woody vegetation, non-woody vegetation) across Austria and Germany at 10m spatial resolution (year: 2018).
Material Stocks (D-A-CH)
Map of material stocks in buildings and infrastructure across Germany and Austria at a spatial resolution of 10m. Includes federal statistics (year: 2018).
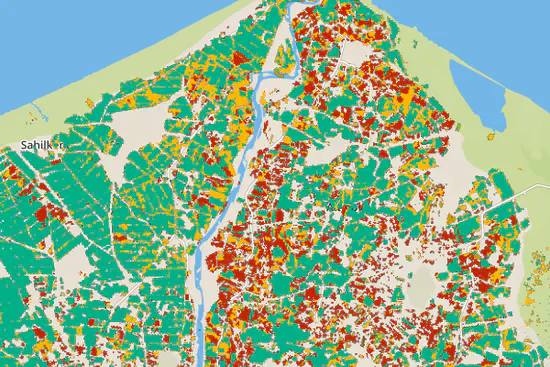
Turkey - Cropping Practices
Map of five different cropping management practices across the entire Turkey at 30m resolution (year: 2015).
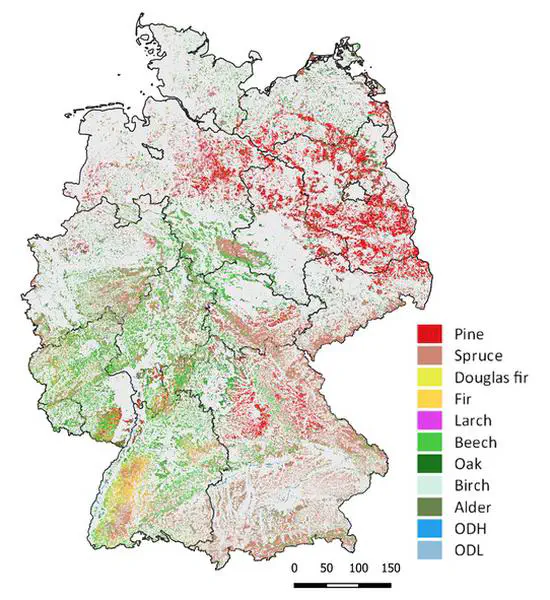
Germany’s tree species 2017/2018
Tree species map for Germany derived from Sentinel-1/2 time series and National Forest Inventory data
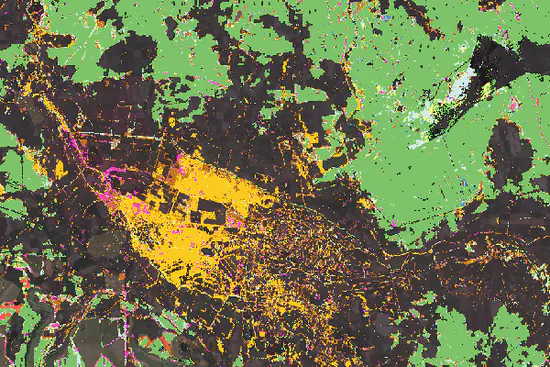
Tree species of Brandenburg 2018
Tree species map for German federal state of Brandenburg derived from Sentinel-2 time series in 10m resolution
Data
Web Services
OpenGIS Web Services (WMS, WFS, WCS)
Software
Software developed in the EOL
Overview
| Name | Purpose | Link |
|---|---|---|
| Bit Flag Renderer | QGIS Plugin to visualize raster image bit flags | https://bit-flag-renderer.readthedocs.io |
| EnMAP-Box | QGIS Plugin to visualize and process hyper spectral remote sensing data, and particularly developed to handle EnMAP products | https://enmap-box.readthedocs.io |
| EO Time Series Viewer | QGIS Plugin to visualize multi-sensor EO time series data | https://eo-time-series-viewer.readthedocs.io |
| FORCE | Framework for Operational Radiometric Correction for Environmental Monitoring | https://github.com/davidfrantz/force |
| FORCE4Q | QGIS Plugin to create higher level EO data products | https://force4q.readthedocs.io |
| GEE Timeseries Explorer | QGIS Plugin to explore temporal raster data available in Google Earth Engine (GEE) | https://geetimeseriesexplorer.readthedocs.io |
| Virtual Raster Builder | QGIS Plugin to creation virtual raster images |
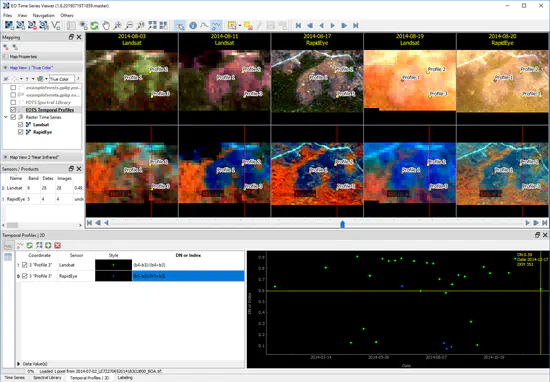
EO Time Series Viewer
A QGIS Plugin to visualize EO time series data from multiple sensors in QGIS
